Today, We want to share with you Angular 6 Chart Example using Charts Package.In this post we will show you Beautiful Angular 6 Charts & Graphs, hear for Simple Demo and Example of PIE Chart in Angular 6 we will give you demo and example for implement.In this post, we will learn about Angular 6 Chart Application Tutorial From Scratch with an example.
Angular 6 Chart Example using Charts Package
There are the Following The simple About Angular 6 Chart Example using Charts Package Full Information With Example and source code.
As I will cover this Post with live Working example to develop Angular 6 Chart Component – Charting and Graphs, so the some major files and Directory structures for this example is following below.
- Angular 6 Charts.
- Install Angular 6.
- Install ng2-charts angular 6 library.
- MAke a server
- Insert Angular 6 HttpClientModule
- Add the ChartsModule.
- Angular 6 display chart.
Angular 6 Example
Angular Latest My Previous Post With Source code Read more…..
- Angular 6 Folder Project Structure
- Angular 6 CLI Installation
- Angular 6 Module File
- Angular 6 Components
- Angular 6 Services
- Angular 6 Routing
- Angular 6 CSS
- Angular 6 Class Binding
- Angular 6 Animation
- Angular 6 Templating
- Angular 6 HTTP Client
Step #1: Install Step By step Angular 6.
using installed Angular CLI
npm install -g @angular/cli
Make a local new project
ng new charts
Step #3: Install Simple ng2-charts.
//install simple ng2-charts
npm install rxjs-compat --save


//install npm main library.
npm install ng2-charts --save
Step #4: Make a server
Make a server that main PHP serves backend get All the data.
yarn global add json-server
db.json
{
    "devlopers": [
    {
        "name": "Dipati",
        "year": "2019",
        "point": "18117"
    },
    {
        "name": "Rahul",
        "year": "2019",
        "point": "100"
    },
    {
        "name": "Rahul",
        "year": "2014",
        "point": "200"
    },
    {
        "name": "Rahul",
        "year": "2016",
        "point": "300"
    },
    {
        "name": "Rahul",
        "year": "2018",
        "point": "100"
    },
    {
        "name": "Priyanka",
        "year": "2019",
        "point": "200"
    },
    {
        "name": "Shital",
        "year": "2019",
        "point": "14460"
    },
    {
        "name": "Bhakti",
        "year": "2019",
        "point": "8006"
    },
    {
        "name": "Bhavika",
        "year": "2019",
        "point": "4879"
    },
    {
        "name": "Rupal",
        "year": "2019",
        "point": "4217"
    },
    {
        "name": "Jaya",
        "year": "2019",
        "point": "1866"
    },
    {
        "name": "Chandni",
        "year": "2019",
        "point": "1848"
    },
    {
        "name": "Krupali",
        "year": "2019",
        "point": "1674"
    },
    {
        "name": "Snehal",
        "year": "2019",
        "point": "1284"
    },
    {
        "name": "Jigar shah",
        "year": "2019",
        "point": "1272"
    },
    {
        "name": "Pratik",
        "year": "2019",
        "point": "967"
    },
    {
        "name": "Nilesh",
        "year": "2019",
        "point": "793"
    },
    {
        "name": "Jignesh",
        "year": "2019",
        "point": "723"
    },
        {
        "name": "Ravi",
        "year": "2019",
        "point": "644"
        },
        {
        "name": "Hitesh",
        "year": "2019",
        "point": "622"
        },
    {
        "name": "Mayur",
        "year": "2019",
        "point": "495"
    },
    {
        "name": "Vijay",
        "year": "2019",
        "point": "430"
    },
    {
        "name": "Vishal",
        "year": "2019",
        "point": "344"
    },
    {
        "name": "Krunal",
        "year": "2019",
        "point": "324"
    },
    {
        "name": "Geeta",
        "year": "2019",
        "point": "542"
    },
    {
        "name": "Ankit",
        "year": "2019",
        "point": "520"
    },
    {
        "name": "Jaydeep",
        "year": "2019",
        "point": "542"
    }]
}
Start JSON Server
json-server --watch db.json --port 4000
Step #5: Add Angular 6 HttpClientModule
app.module.ts
// app.module.ts

import { HttpClientModule } from '@angular/common/http';

imports: [
    ...
    HttpClientModule
],
app.component.ts
// app.component.ts

import { Component } from '@angular/core';
import { HttpClient } from '@angular/common/http';

@Component({
  selector: 'app-root',
  templateUrl: './app.component.html',
  styleUrls: ['./app.component.css']
})
export class AppComponent {
  title = 'app';
  constructor(private httpClient: HttpClient) {}
}
Step #6: Import Angular 6 ChartsModule.
app.module.ts
// app.module.ts

import { ChartsModule } from 'ng2-charts';

imports: [
    ...,
    ChartsModule
  ],
Step #7: display chart.
app >> Data.ts
// Data.ts

export interface Data {
    name: String;
    year: Number;
    point: Number;
}
app.component.ts
import { Component, OnInit } from '@angular/core';
import { HttpClient } from '@angular/common/http';
import { Data } from './Data';

//Angular 6 Chart Example using Charts Package
@Component({
  selector: 'app-root',
  templateUrl: './app.component.html',
  styleUrls: ['./app.component.css']
})

export class AppComponent implements OnInit {

  title = 'app';
  data: Data[];
  url = 'http://localhost:4000/devlopers';
  year = [];
  point = [];

  public lineChartData: Array = [
    {data: this.point, label: 'Rahul Devlopers'},
  ];
  public lineChartLabels: Array = this.year;
  public lineChartOptions: any = {
    responsive: true
  };
  public lineChartColors: Array = [
    {
      backgroundColor: 'rgba(192,151,232,0.2)',
      borderColor: 'rgba(192,151,232,1)',
      pointBackgroundColor: 'blue',
      pointBorderColor: 'blue',
      pointHoverBackgroundColor: '#3d3d3d',
      pointHoverBorderColor: 'rgba(192,151,232,0.8)'
    }
  ];
  public lineChartLegend: Boolean = true;
  public lineChartType: String = 'line';
 //simple Angular 6 Chart Example using Charts Package
  constructor(private httpClient: HttpClient) {}

  ngOnInit() {
    this.httpClient.get(this.url).subscribe((res: Data[]) => {
      this.data = res.filter(r => {
        return r.name === 'Rahul';
      });
      this.data.forEach(y => {
        this.year.push(y.year);
        this.point.push(y.point);
      });
    });
  }
}
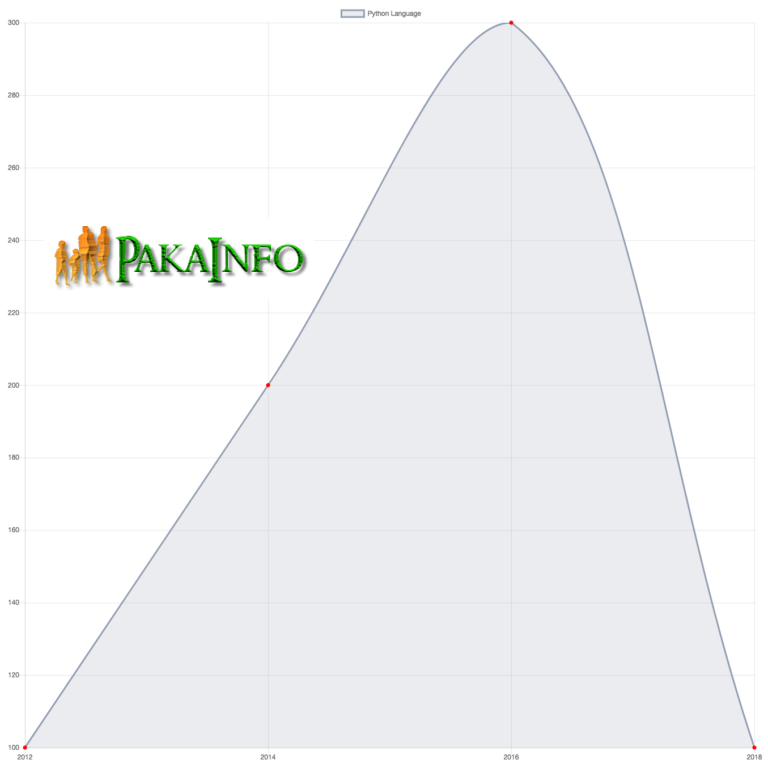
Angular 6 Chart – Output
- Angular 6 applications – Insert, Fetch , Edit – update , Delete Operations
- Angular 6 CRUD
- Angular 6 and ASP.NET Core 2.0 Web API
- Angular 6 features
- Angular 6 Form Validation
- Angular 6 – User Registration and Login
- Angularjs 6 User Registration and Login Authentication
- Angular 6 CLI Installation Tutorial With Example
- Angular 6 Toast Message Notifications From Scratch
Angular 6 CRUD Operations Application Tutorials
Read :
Summary
You can also read about AngularJS, ASP.NET, VueJs, PHP.
I hope you get an idea about Angular 6 Chart Example using Charts Package.
I would like to have feedback on my Pakainfo.com blog.
Your valuable feedback, question, or comments about this article are always welcome.
If you enjoyed and liked this post, don’t forget to share.